Kristian B. Ørnsø, Juan M. García-Lastra and Kristian S. Thygesen
Computational screening of functionalized zinc porphyrins for dye sensitized solar cells
Phys. Chem. Chem. Phys., 2013, 15, 19478-19486
We present a computational screening study of more than 12,000 porphyrin- based dyes obtained by modifying the porphyrin backbone (metal center and axial ligands), substituting hydrogen by fluorine, and adding different side and anchoring groups.
The first 5145 porphyrins are described in:
Kristian B. Ørnsø, Juan M. García-Lastra and Kristian S. Thygesen
Computational screening of functionalized zinc porphyrins for dye sensitized solar cells
Phys. Chem. Chem. Phys., 2013, 15, 19478-19486
Kristian B. Ørnsø, Christian S. Pedersen, Juan M. García-Lastra and Kristian S. Thygesen
Optimizing porphyrins for dye sensitized solar cells using large-scale ab initio calculations
Phys. Chem. Chem. Phys., 2014, 16, 16246-16254
Examples of using the database can be found in:
Kristian B. Ørnsø, Juan M. García-Lastra, Gema De La Torre, F. J. Himpsel, Angel Rubio and Kristian S. Thygesen
Design of two-photon molecular tandem architectures for solar cells by ab initio theory
Chem. Sci., 2015, 6, 3018-3025
Kristian B. Ørnsø, Elvar Ö. Jónsson, Karsten W. Jacobsen and Kristian S. Thygesen
Phys. Chem. C, 2015, 119, 12792-12800

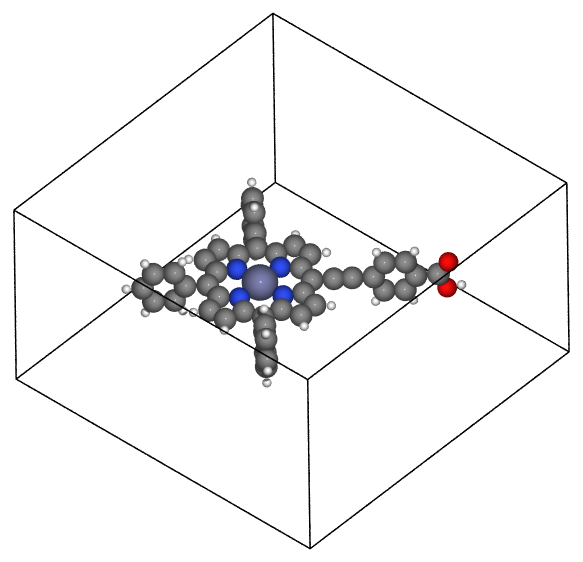
Example of dye with: M=ZnP, A=EthynPhA, R1=Ph, R2=Ph, R3=Ph
key |
description |
unit |
|---|---|---|
|
Metal center |
|
|
Anchor group |
|
|
First side group |
|
|
Second side group |
|
|
Third side group |
|
|
Kohn-Sham HOMO eigenvalue |
eV |
|
Kohn-Sham LUMO eigenvalue |
eV |
|
KS gap (KS_LUMO - KS_HOMO) |
eV |
|
IP |
eV |
|
EA |
eV |
|
EA - IP |
eV |
|
Cond. band - IP |
eV |
|
Triplet optical gap |
eV |
|
IP + troiplet |
eV |
|
Level align. 1 |
eV |
|
Level align. 2 |
eV |
|
UsedE1 |
|
|
UsedEc |
|
|
DSSC |
|
|
GPAW-potential |
|
|
GPAW-version |
|
|
XC |
|
|
DB-screen |
# creates: homolumo.svg
import matplotlib.pyplot as plt
import ase.db


def plotter(M, A, c):
    """Function to get and plot E_HOMO and E_LUMO against E_gap for a given
    metal center and anchor group."""

    EH = []
    EL = []
    EG = []
    for row in c.select(M=M, A=A):  # select dyes with a specific M and A
        EL.append(row.E_LUMO)
        EH.append(row.E_HOMO)
        EG.append(row.E_gap)
    # Set colors based on metal center:
    cl = {'ZnP': 'red',
          'FZnP': 'gold',
          'TiOP': 'magenta',
          'FTiOP': 'purple',
          'TiO2RP': 'pink',
          'FTiO2RP': 'cadetblue',
          'H2P': 'orange',
          'FH2P': 'coral'}[M]

    # Set symbol based on anchor group:
    mk = {'EthynPhA': 's',
          '2CarboxyPropenA': 'o',
          '2CyanoPropenA': '^',
          'EthenThPCyanoAcryl': 'v',
          'DThPCyanoAcryl': '<',
          'EthynDThPA': '>',
          'EthynBTDPhA': '8',
          'EthynPhM': 'p',
          'EthynThPA': '*',
          'EthynDPhEPhA': 'h',
          'EthynThPCyanoAcryl': '+',
          'EthynPhEPhA': 'x',
          'EthynDThPCyanoAcryl': 'd',
          'EthynFuA': 'D',
          'ThPCyanoAcryl': 'H',
          'EthynTPhEPhA': '1',
          'EthenCyanoAcryl': '2',
          'EthynPhDA': '3'}[A]

    plt.plot(EG, EH, color=cl, marker=mk, linestyle='None')
    plt.plot(EG, EL, color=cl, marker=mk, linestyle='None')


c = ase.db.connect('dssc.db')

for M in ['ZnP', 'TiOP', 'H2P']:  # metal centers
    for A in ['EthynPhA', '2CarboxyPropenA', '2CyanoPropenA']:  # anchor groups
        plotter(M, A, c)
    plt.ylabel(r'Energy (eV)', fontsize=18)
    plt.xlabel(r'$E_{\mathrm{gap}}$ (eV)', fontsize=18)
    plt.savefig('homolumo.svg')