Chemisorption of gas atoms on one-dimensional transition-metal halides
Hadeel Moustafa, Jens Jørgen Mortensen, Jan Rossmeisl, and Karsten Wedel Jacobsen
arXiv: … (cond-mat)
Chemisorption of gas atoms on one-dimensional transition-metal halides
Hadeel Moustafa, Jens Jørgen Mortensen, Jan Rossmeisl, and Karsten Wedel Jacobsen
arXiv: … (cond-mat)
Download database: ads1d.db
…
key |
description |
unit |
|---|---|---|
|
X |
|
|
Y |
|
|
XY3 formula units |
|
|
Adsorbate |
|
|
Workfunction |
V |
|
Adsorption energy |
eV |
|
Coverage |
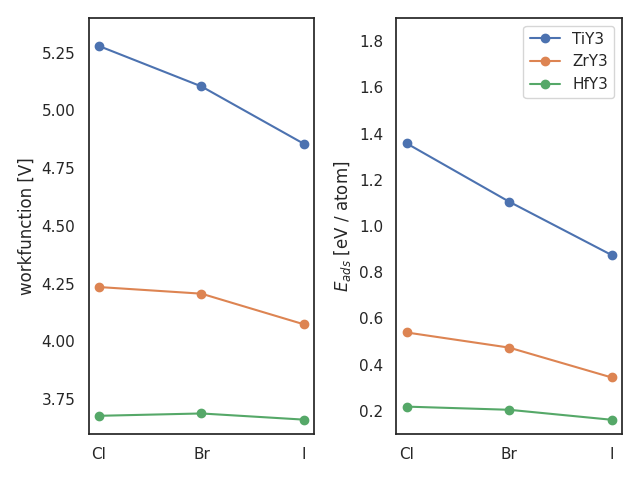
Here is an example creating figure 5 from …:
# creates: fig5.png
from ase.db import connect
import matplotlib.pyplot as plt

db = connect('ads1d.db')

fig, (ax1, ax2) = plt.subplots(ncols=2)
y = ['Cl', 'Br', 'I']
x = ['Ti', 'Zr', 'Hf']
for X in x:
    wf = []
    ea = []
    for Y in y:
        row = db.get(x=X, y=Y, n=2, adsorbate='H', coverage=0.5)
        ea.append(row.eads)
        row = db.get(x=X, y=Y, n=2, natoms=8)
        wf.append(row.workfunction)
    ax1.plot(wf, 'o-', label=f'{X}Y3')
    ax2.plot(ea, 'o-', label=f'{X}Y3')
ax1.set_xticks([0, 1, 2], y)
ax2.set_xticks([0, 1, 2], y)
ax1.set_ylabel('workfunction [V]')
ax2.set_ylabel(r'$E_{ads}$ [eV / atom]')
ax1.set_ylim(3.6, 5.4)
ax2.set_ylim(0.1, 1.9)
plt.legend()
plt.tight_layout()
plt.show()
plt.savefig('fig5.png')