Estefanía Garijo del Río, Sami Kaappa, José A. Garrido Torres, Thomas Bligaard and Karsten W. Jacobsen
Machine Learning with bond information for local structure optimizations in surface science
The Paper:
Estefanía Garijo del Río, Sami Kaappa, José A. Garrido Torres, Thomas Bligaard and Karsten W. Jacobsen
Machine Learning with bond information for local structure optimizations in surface science
The data can be downloaded or browsed online:
Download data: bondmin.db
Browse data: comming soon …
This database contains the results of the optimization tests with BondMin and other optimizers (validation and results section of the paper).
The dataset key indicates the test the entry corresponds to. The names of the datasets are the same as in the paper, and a description of the data set can be found in the paper in the data sets section.
A script generating these datasets, as well as the code to run the optimizers can be found at:
# creates: bondmin.png
import matplotlib.pyplot as plt
import pandas as pd
import seaborn as sns
from ase.db import connect
sns.set(style='whitegrid')
sns.set_context('notebook')
db = connect('bondmin.db')
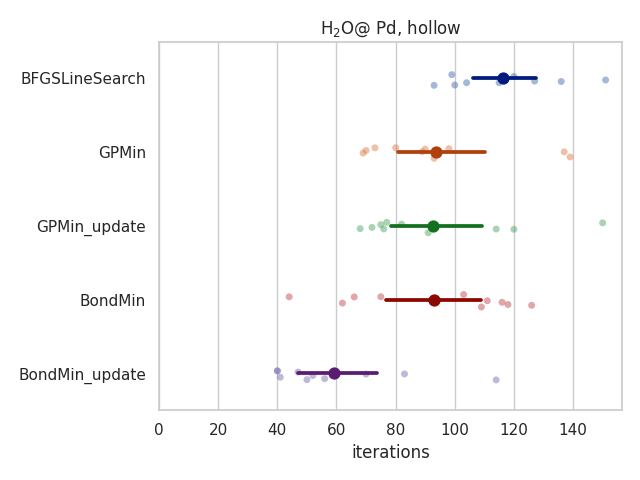
selection = 'dataset=MS5,formula=Pd8H2O'
df = {'optimizer': [], 'n': []}
for row in db.select(selection):
if 'hollow' not in row.name:
continue
df['optimizer'].append(row.optimizer)
df['n'].append(row.n)
df = pd.DataFrame(df)
sns.stripplot(x='n', y='optimizer', hue='optimizer',
data=df, alpha=0.5,
zorder=1, palette='deep')
sns.pointplot(x='n', y='optimizer', hue='optimizer',
data=df, linestyles='none',
palette='dark')
plt.xlim(left=0.)
plt.xlabel('iterations')
plt.ylabel('')
plt.title(r'H${}_2$O@ Pd, hollow')
plt.tight_layout()
plt.savefig('bondmin.png')
plt.close()