Peter Mahler Larsen, Mohnish Pandey, Mikkel Strange, and Karsten W. Jacobsen
Definition of a scoring parameter to identify low-dimensional materials components
Phys. Rev. Materials 3 034003, 2019
Peter Mahler Larsen, Mohnish Pandey, Mikkel Strange, and Karsten W. Jacobsen
Definition of a scoring parameter to identify low-dimensional materials components
Phys. Rev. Materials 3 034003, 2019
The data can be downloaded or browsed online:
Download data: lowdim.db
The analyses of two databases are available here: the Inorganic Crystal Structure Database (ICSD) and the Crystallography Open Database (COD). The COD database contains the full structures, dimensionality scores, and publication information, for every structure with at most 200 atoms. For copyright reasons, the atomic positions of the ICSD entries cannot be shown here; only the formulae, ICSD code, and dimensionality scores are shown.
key |
description |
unit |
|---|---|---|
|
0D score |
|
|
1D score |
|
|
2D score |
|
|
3D score |
|
|
0D+1D score |
|
|
0D+2D score |
|
|
0D+3D score |
|
|
1D+2D score |
|
|
1D+3D score |
|
|
2D+3D score |
|
|
0D+1D+2D score |
|
|
0D+1D+3D score |
|
|
0D+2D+3D score |
|
|
1D+2D+3D score |
|
|
0D+1D+2D+3D score |
|
|
Start of 0D k-interval |
|
|
Start of 1D k-interval |
|
|
Start of 2D k-interval |
|
|
Start of 3D k-interval |
|
|
Start of 0D+1D k-interval |
|
|
Start of 0D+2D k-interval |
|
|
Start of 0D+3D k-interval |
|
|
Start of 1D+2D k-interval |
|
|
Start of 1D+3D k-interval |
|
|
Start of 2D+3D k-interval |
|
|
Start of 0D+1D+2D k-interval |
|
|
Start of 0D+1D+3D k-interval |
|
|
Start of 0D+2D+3D k-interval |
|
|
Start of 1D+2D+3D k-interval |
|
|
Start of 0D+1D+2D+3D k-interval |
|
|
End of 0D k-interval |
|
|
End of 1D k-interval |
|
|
End of 2D k-interval |
|
|
End of 3D k-interval |
|
|
End of 0D+1D k-interval |
|
|
End of 0D+2D k-interval |
|
|
End of 0D+3D k-interval |
|
|
End of 1D+2D k-interval |
|
|
End of 1D+3D k-interval |
|
|
End of 2D+3D k-interval |
|
|
End of 0D+1D+2D k-interval |
|
|
End of 0D+1D+3D k-interval |
|
|
End of 0D+2D+3D k-interval |
|
|
End of 1D+2D+3D k-interval |
|
|
End of 0D+1D+2D+3D k-interval |
|
|
Number of 0D components |
|
|
Number of 1D components |
|
|
Number of 2D components |
|
|
Number of 3D components |
|
|
Source |
|
|
ID # |
|
|
DOI |
|
|
Publication |
|
|
Space group # |
|
|
Dimensionality |
|
|
Component count |
|
|
Warning |

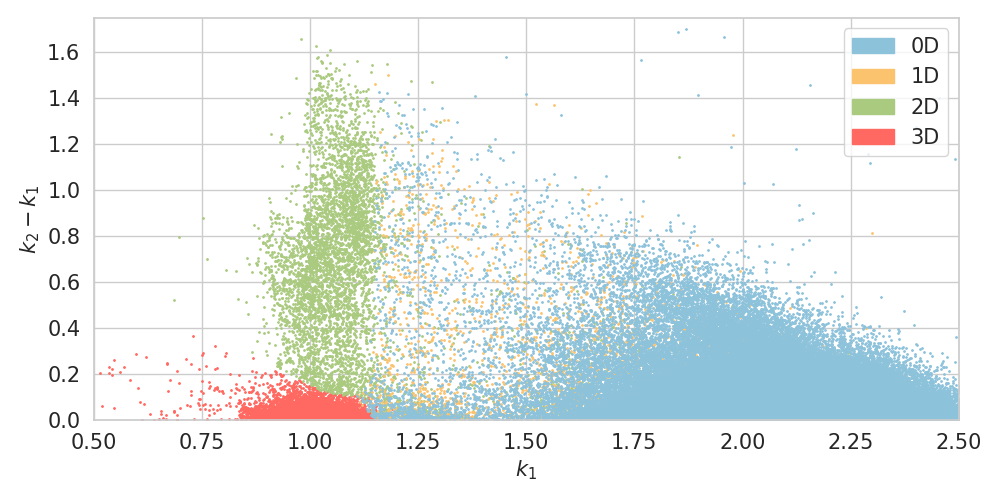
# creates: lowdim.png
import numpy as np
from ase.db import connect
import matplotlib
import matplotlib.pyplot as plt
from matplotlib.patches import Patch

fontsize = 15
matplotlib.rcParams['xtick.labelsize'] = fontsize
matplotlib.rcParams['ytick.labelsize'] = fontsize


def run_example():
    c = connect('lowdim.db')
    rows = [r for r in c.select()]

    dims = [0, 1, 2, 3]
    colors = ['#8dc2db', '#fbc36e', '#aaca7f', '#ff6961']

    data = []
    for row in rows:
        if 'a_2' in row and 'b_2' in row:
            k1 = row.a_2
            k2 = row.b_2
            dim = int(row.dimtype[:-1])
            if dim in dims:
                data.append((k1, k2 - k1, dim))
    data = np.array(data)

    plt.figure(figsize=(10, 5))
    for dim in dims[::-1]:
        indices = np.where(data[:, 2] == dim)[0]
        xs = data[indices, 0]
        ws = data[indices, 1]
        plt.scatter(xs, ws, c=colors[dim], s=1)

    patches = [Patch(color=colors[dim], label="%dD" % dim) for dim in dims]
    plt.legend(handles=patches, loc='upper right', fontsize=fontsize)

    plt.xlim(0.5, 2.5)
    plt.ylim(0, 1.75)
    plt.xlabel(r'$k_1$', fontsize=fontsize)
    plt.ylabel(r'$k_2 - k_1$', fontsize=fontsize)

    plt.tight_layout()
    plt.savefig('lowdim.png')
    plt.close()


run_example()